Glaring Lacuna in the Design for Meeting Global Water Needs Exposed
By R. Ashok Kumar, B.E.,M.E(Power), Negentropist, Bombay Sarvodaya Mandal, 299, Tardeo Road, Nana Chowk, Mumbai-400007.
© 2013 Ramaswami Ashok Kumar
Dams worldwide for meeting water needs are causing the direct heating up of the earth by friction between earth surfaces resulting in rocks to melt, ensuing in damage-causing and killer earthquakes globally. Daily surges in regional total dam contents cause water pressures to reach hundreds of kilometers every second at the centers of gravity of heavily dammed regions. These giant sledge hammer effects cause surges of Love and Raleigh waves to travel through the crust of the earth and cause friction between the two surfaces of resisting points in the earth. Huge bending moments and forces ensure that the rock melts resulting in damage-inflicting earthquakes(1). Here the day to day operation of dams is summarised which reveals a simple way to predict imminent strong to great earthquakes which occur in days to weeks from giant surges in daily dam contents.
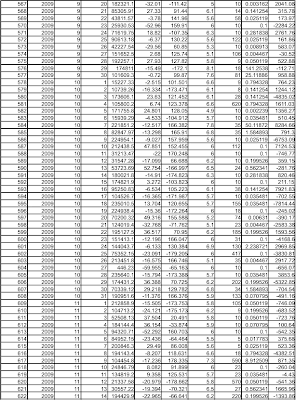
Table 1 shows the global daily peak magnitude earthquake data and the daily surge in total dam contents of 31 Indian dams with a total capacity of 238.743 BCM and electrical capacity of 38144 MW. This is for the period 1 March 2008 to 31 March 2011. Inspection of this table reveals that whenever there is a surge of say 5 BCM(1 BCM= 1000000000 cubic meters) or more, an earthquake of magnitude 6-9 MM follows a few days to weeks away(Moment Magnitude-measure of the magnitude of the earthquake). For an explanation of technical terms you may Google search for the item of interest). Samples of this more than 1000 day data were taken from Table 1 and studied for correlation of daily change in total dam contents(dMCM) with the Seismic Moment(Newton-meters) of the daily peak magnitude earthquake. The sample size varied from 14 to 371(mean 190,standard deviation 101). The samples were staggered through the whole data base of Table 1. All the sample correlations were statistically significant(Table 2). When all the dam content surges of 5BCM or more were removed from the data of Table 1, none of the samples showed significant correlation(Table 3). Instead of removing the stated high dam content surges, if the earthquakes of magnitude 7 MM or more were removed, they also revealed no significant correlations(Table 4).The chi-squared sums for tables 2,3 and 4 all had unity probability thus showing that the results were significant for the scientifically rigorous inference that dam surges are unleashing worldwide earthquakes of damage causing magnitudes. These results are also consistent with rainfall measurements and hotspot data(Figure 1).
The average picture or the central tendency is that with dam surges of 5 BCM and above occurring every ten days (6 to 13 days), earthquakes of magnitude 6 MM and above occur every three days and those of magnitude 7 MM and over occur every 22 days(17 to 28 days). The ranges are at a confidence level of 95%. This is for the 30 Indian dams alone.
Meeting water needs by dams endangers life and safety of structures by earthquakes and possible ensuing tsunamies as happened in the 9 MM great earthquake off Fukushima and the 6.8 MM quake at Kashiwasaki Kariwa and during the aftermath of the 26th December 2004 Andaman Bay great quake.
Note that the stress build up as given here would also calculate the Honshu Great Earthquake nearer to 9.0 MM !
The truth of a law that worldwide dams are causing earthquakes is reconfirmed with increasing data in the time series leading to positive results. Taking thus the hydrological year June 2011 to May 2012 as of date(26th January 2012), I again find significant correlation of the forcing function of Change in Daily Total Contents of 30 Indian Dams with the Worldwide Daily Peak Magnitude Earthquake's Seismic Moment(r 0.47, degrees of freedom 238, p 1.77E -14), with a 90 day lead for the dam content array.
See how the core of MOX filled Fukushima reactor itself has exploded:
That is why the infinitely superior structures called forests were created. The need of the hour is to meet water needs by recharging groundwaters by massive people initiated, people benefiting ecological analogous reforestation for millennia. See http://practicethevedas.blogspot.com/
See also http://livingnormally.blogspot.com/
and http://banksretreeworldecologically.blogspot.com/
Now Fukushima gives a glaring example of how unwise it is not to reforest the earth(using fusion of the sun situated safely 150 million kilometers from the earth) ecologically as the above three URLs highlight. On April 22 2011: Japan has declared a 20 km radius around the Fukushima plant as an uninhabitable zone(strictly for human beings only). This means an area of at least 1200 km^2 which could have become a beautiful gravity defying forest with a dry biomass density sufficient to cause a power flow through the vegetation of 1200 gigawatts(GW) has been replaced by a big big, zero power, death dealing radiation zone- replacing forever the 9.9 GW nuclear park! With modern civilisation going blindly ahead with nukes, we have the devastation of the world on our involuntary hands. As this URL glaringly brings out we are heading for several Chernobyls perhaps every year or two.
2. Data for rainfall is from http://imd.gov.in
3. Data for hotspots is from FIRMS: Fire Information for Resource Management System: http://maps.geog.umd.edu/firms/


